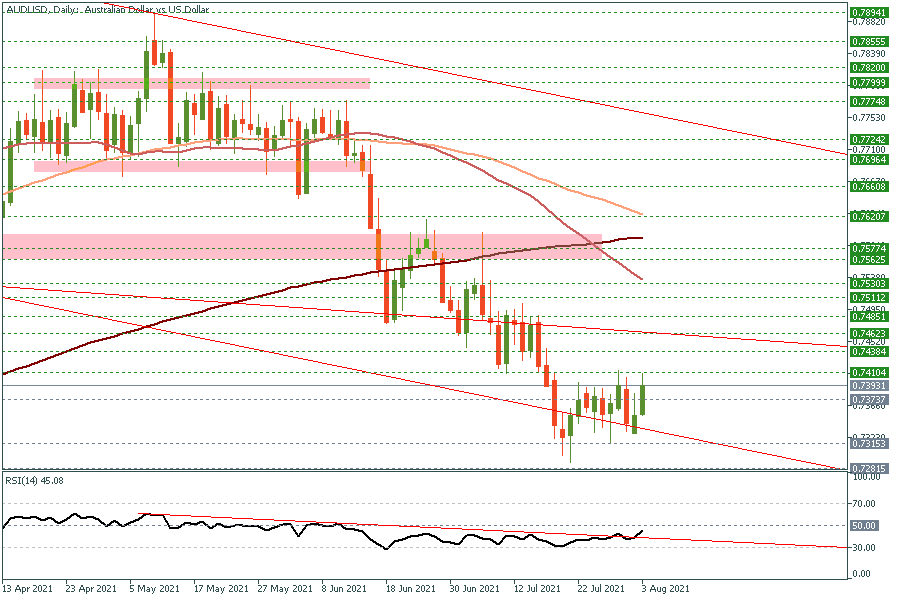
The Reserve Bank of Australia decided to keep the current policy unchanged as widely expected. However, and against all odds, the bank took the first steps toward winding back emergency monetary stimulus for an economy that’s exceeded forecasts. The BRA made this move even though many saw the bank hinting for a possible increase in asset purchases amid partial lockdown in parts of the county due to the high rate of covid19 cases. Yet, the plan to taper by 1B in September could be a message that the RBA is seeing some inflation pressure on the horizon. In the meantime, AUD/USD is still in a retracement mode, which may target 0.7470 and 0.7530’s before the downside trend resumes. Therefore, I would long some AUD/USD around here 0.7380’s with a stop at today’s low only.
Reference: FBS (03.08.2021) RBA sticks to tapering plan. FBS analytic news.
Please visit our sponsors
Results 21 to 30 of 40
Thread: Daily News
-
03-08-2021, 01:57 PM #21Senior Investor

- Join Date
- Apr 2018
- Posts
- 509
- Feedback Score
- 0
- Thanks
- 0
- Thanked 0 Times in 0 Posts

-
08-08-2021, 05:07 AM #22Senior Investor

- Join Date
- Apr 2018
- Posts
- 509
- Feedback Score
- 0
- Thanks
- 0
- Thanked 0 Times in 0 Posts

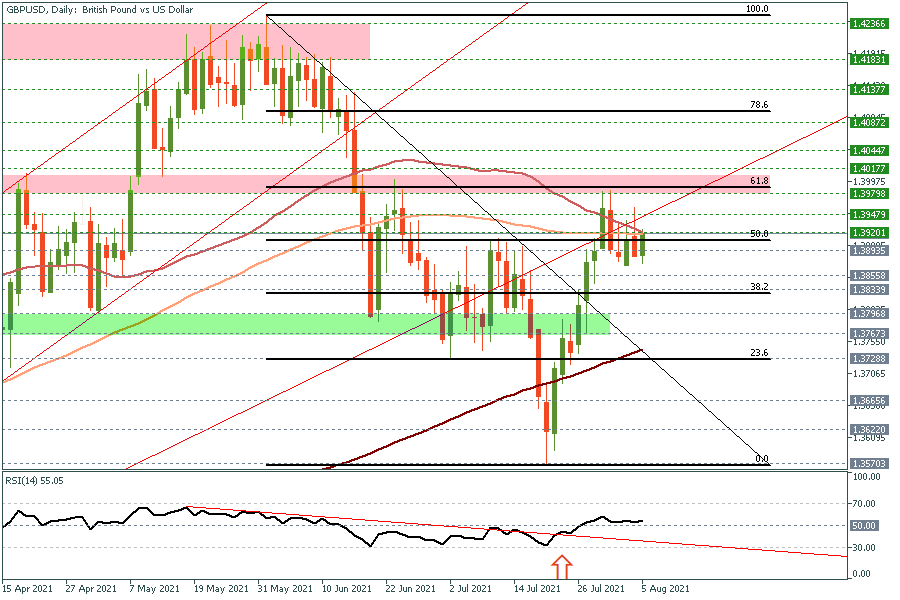
GBP/USD is currently trading within a new selling zone on both short and medium-term charts. The zone stands between 1.3915 and 1.3990 which represents its 50% and 61.8% of the recent selloff from June 1st top to July 20th bottom. This area remains solid since last week, while we wait for the Bank of England's decision later today. Yet, it would still be worth it to risk a short position with a stop above 1.4020, especially after the pair failed to break above its 100 and 50-day MA’s yesterday, while the technical indicators remain around the 50 mid-point (RSI). On the downside view, the first initial target would be 1.38 which could be seen later today, especially if the BoE decides to avoid tapering discussions.
Reference: FBS (05.08.2021) GBP/USD Selling Zone! FBS analytic zone.
-
09-08-2021, 02:26 PM #23Senior Investor

- Join Date
- Apr 2018
- Posts
- 509
- Feedback Score
- 0
- Thanks
- 0
- Thanked 0 Times in 0 Posts

What is happening?
The Senate of the US has voted for an amendment to President Biden’s infrastructure bill. The Senate allows for 30 hours of debate following a vote. This means that the amendment can be debated up until Tuesday morning, after which it would be signed into law.
Senate deliberations continued over the weekend over a $1 trillion infrastructure bill, with a particular focus on how the bill could impact the world of cryptocurrency. The bill includes a tax provision that outlines plans to raise about $28 billion for that $1 trillion package through taxes from crypto transactions. The bill identifies a “broker” as anyone “responsible for and regularly providing any service effectuating transfers of digital assets on behalf of another person,” and anyone thus identified would be subject to tax reporting requirements.
Cryptocurrency investors are unhappy with the new tax provision. Not only it defines miners and cryptocurrency wallet makers as brokers, but it also obliges companies to report information about individuals even if they are not customers. Passing the bill will have a bloody impact on the cryptocurrency market, as well as on all companies somehow connected to it.
More on Coinbase
Coinbase now supports Apple Pay when buying cryptocurrency, meaning that users can buy with debit cards that are linked to Apple's system. Coinbase is the first crypto exchange to offer instant transactions via Real-Time Payments (RTP), enabling customers in the U.S. with linked bank accounts to instantly and securely cash out up to $100,000 per transaction.
It is important to notice that Coinbase makes the most of its profit in the most volatile markets, due to increased trading volumes and therefore increased amount of fees collected. Nevertheless, Coinbase stock correlation with Bitcoin price is hard to underestimate. Such an effect is caused by the nature of Coinbase as a cryptocurrency exchange and the majority opinion that everything somehow linked to crypto needs to correlate with Bitcoin price movements.
Technical analysis
Right now, Coinbase is breaking through resistance lines, after forming a “triple bottom” reversal pattern. RSI is also looking quite bullish. If the news about the infrastructure bill won’t crash the price, the next resistance line will be at $300, a round number, and a Fibonacci expansion 161.8 line. Otherwise, there is a big support area between $250 and $235.Bitcoin is moving in a channel, that has been already broken once. RSI has formed a bearish divergence, so it’s dangerous to open a long position now. In case of a price falling, the main support area is $40000-$39000.

Reference: FBS (09.08.2021) How does new infraestructure bill affect coinbase? FBS analytic news.
-
10-08-2021, 04:33 PM #24Senior Investor

- Join Date
- Apr 2018
- Posts
- 509
- Feedback Score
- 0
- Thanks
- 0
- Thanked 0 Times in 0 Posts

Current news:
- Reserve Bank of New Zealand will likely deliver up to two interest rate hikes before the end of the year.
- Risk-off flows strengthening in the NZD/USD pair.
- Chinese economic outlook downgrade, inflation causing concern.
The risk-sensitive New Zealand Dollar weakened overnight as global concerns over the highly transmissible Delta Covid variant weighed on sentiment. The US Dollar is also weighing on NZD as rate hike bets rise following last week’s NFP report. Moreover, Goldman Sachs downgraded its growth forecast for China. Analysts at the bank see Covid-induced lockdowns and social distancing measures dragging on spending and consumption.
Why is it important?
Foreign exchange markets are presently focused on central bank interest rate normalization, favoring the currencies belonging to those central banks which will lead the pack. July 14, 2021, RBNZ (Reserve Bank of New Zealand) said it will reduce monetary stimulus by ceasing quantitative easing. It was the first sign of a future interest-rate increase. Shortly after, New Zealand’s unemployment rate was released, with actual results being less-than-expected by as much as 0.4% (4% vs. 4.4%, this is a good sign to an overall economic situation).
The labor market report is the latest sign that the economy is growing faster than its capacity, and that the Reserve Bank could start to raise the official cash rate to keep a lid on price pressures. Annual inflation surged to 3.3% in the second quarter, breaching the central bank’s 1-3% target range.
If RBNZ continues normalizing interest rates by raising them, we would expect strong fundamental support for the New Zealand Dollar. August 18, RBNZ will release several essential market reports. Among them are the Official Cash Rate, RBNZ Monetary Policy Statement, and Rate Statement. Considering the facts given, we’re expecting rate hikes as well as NZD strengthening against other currencies.
However, while the Chinese economy is vital to global growth and capital markets, New Zealand is particularly susceptible due to its economic and trade proximity. Covid related risks are also present, although the market participants ignored Delta's initial spread. Make sure to check our Economic Calendar regularly!
Technical analysis:
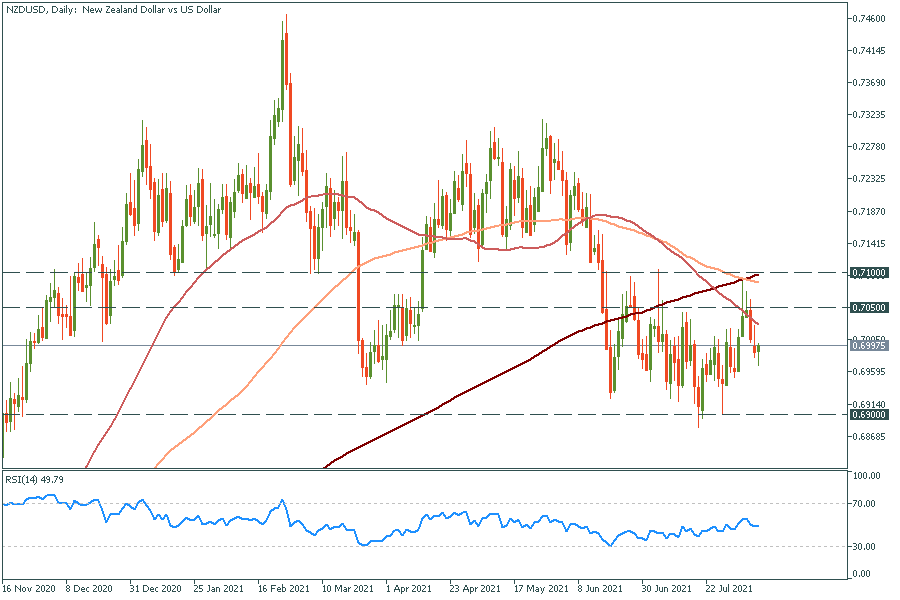
Looking at the NZD/USD live chart we can see a support line at 0.690 and we have a resistance between 0.705 and 0.710, where the “death cross” bearish pattern has emerged.Considering the newfound pessimism for the economic outlook in China, the New Zealand Dollar may remain capped near current levels. Still, NZD bulls may be able to take advantage of the situation. The Australian Dollar typically displays a higher correlation with China’s economy, which can open the door for AUD/NZD to underperform.Currently, AUD/NZD pair has a support line at 1.04594 and resistance at 1.10595, right at 38.2 Fibonacci retracement level.
Reference: FBS (10.08.2021) NZD is expiriencing challenges with forecast. FBS analytic news.
-
12-08-2021, 01:35 PM #25Senior Investor

- Join Date
- Apr 2018
- Posts
- 509
- Feedback Score
- 0
- Thanks
- 0
- Thanked 0 Times in 0 Posts

EURUSD declined slightly at the beginning of yesterday’s trading, reaching as low as 1.1705 right before the US data. The pair then bounced off that support all the way to 1.1750’s, leading our long position to be in profit once again. In the meantime, we maintain the stop at 1.1690 ahead of today’s session. The current signal comes as a short-term play after the Euro declined for 8 straight sessions. At the same time, if the pair managed to break above 1.1750 today, I would move my stop to the entry in order to protect the position from any possible loss.

Reference: FBS (12.08.2021) EURUSD Trade update. FBS analytic news.
-
13-08-2021, 01:21 PM #26Senior Investor

- Join Date
- Apr 2018
- Posts
- 509
- Feedback Score
- 0
- Thanks
- 0
- Thanked 0 Times in 0 Posts

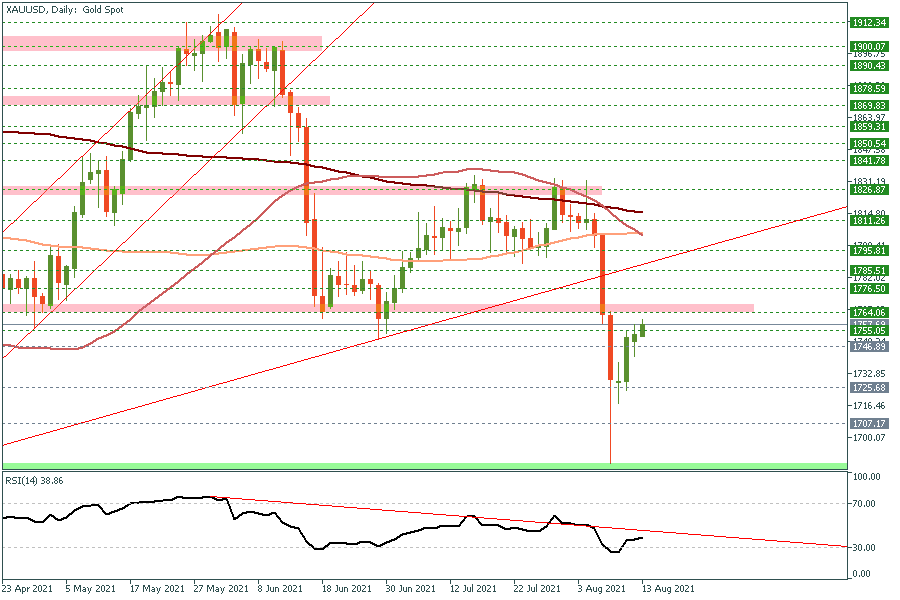
Gold managed to recover over 50% of its flash crash that occurred at the beginning of this week. After stabilizing above 1725, we issued a long signal at 1730 two days ago, and gold managed to rise all the way to 1759 until this report is released. In the meantime, it would be wise to move the stop to our entry to protect our position from any possible loss, while a weekly close above 1750 and preferably above 1760 would be another bullish sign not only on the short-term but on the medium-term as well.
Reference: FBS (13.08.2021) Gold Trying to break higher. FBS analytic news.
-
20-08-2021, 09:10 PM #27Senior Investor

- Join Date
- Apr 2018
- Posts
- 509
- Feedback Score
- 0
- Thanks
- 0
- Thanked 0 Times in 0 Posts

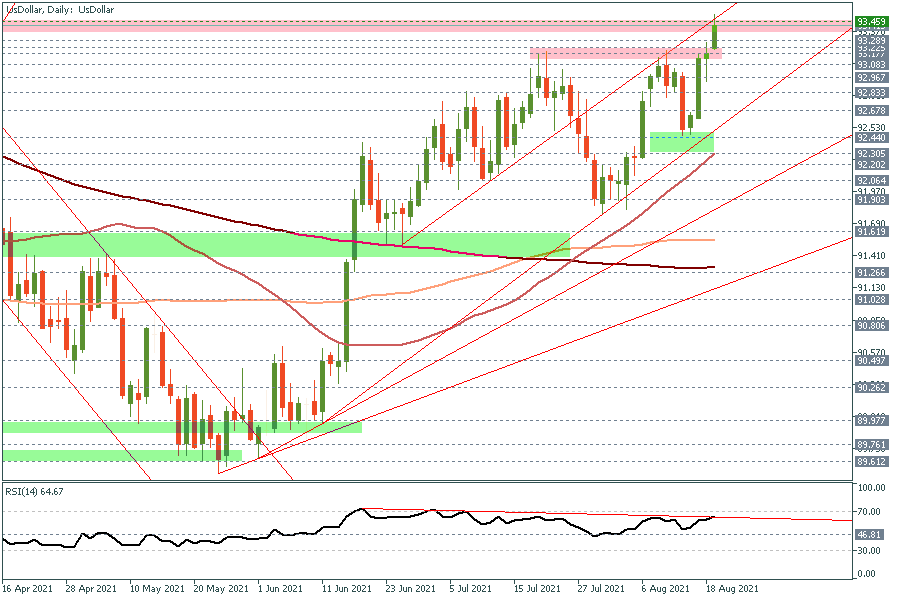
The US Dollar soared higher since the beginning of the Asian session until this report is released. Such rally comes as a reason of the Asian and the European markets to the Federal Reserve meeting minutes, which showed that the Fed is somehow preparing the markets for QE tapering before the end of this year, which could actually happen in December's meeting.
However, the Fed also stressed that they are still watching Covid19-Delta developments in the US, as infection rate is still increasing, and if things for even worse, the fed might delay such decision. Yet, the market is not concerned about delta yet, they are now concerned about lower liquidity by the Fed and other central banks, and therefore we are seeing a broad selloff across the board.
In the meantime, I would stand aside and watch how the US market will react today, as the current move might be a bit excessive, as the info that we got from the meeting minutes is not something new. But such move, could be a new opportunity for those who likes swing trades.
As for today, I will be watching 93.50 resistance area as it won't be easy to be broken. Another downside retracement is highly possible, which may retest the 93.0 support area, before the upside trend resumes.
Reference: FBS (19.08.2021) USD Skyrocketing. FBS analytic news.
-
24-08-2021, 03:37 AM #28Senior Investor

- Join Date
- Apr 2018
- Posts
- 509
- Feedback Score
- 0
- Thanks
- 0
- Thanked 0 Times in 0 Posts

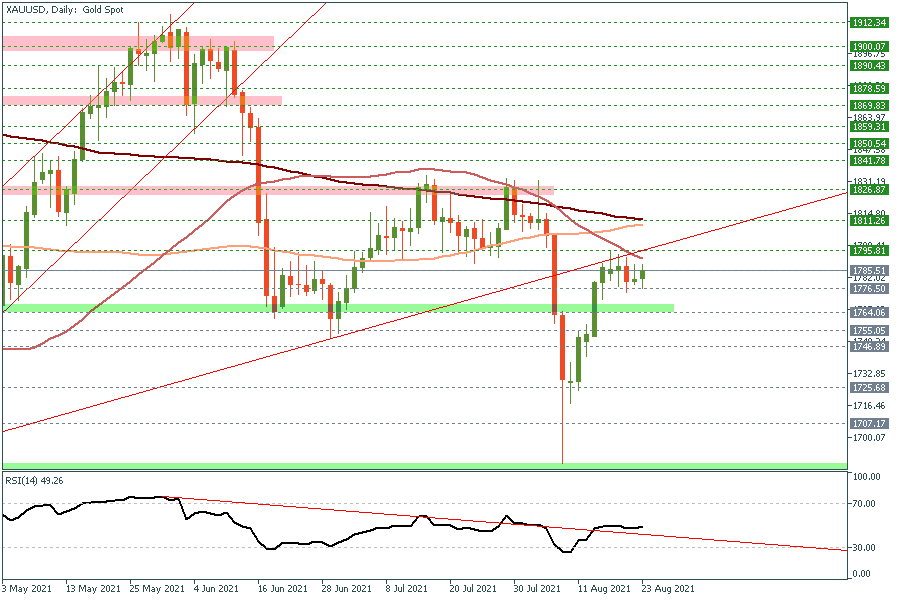
Throughout last week’s trading, gold traded within a tight range, but it also managed to hold well above its 1775 support area until the end of the week, while the technical indicators has improved over the past few days, including the RSI indicator, which is now trading above the 50 mid-point and broke its daily down trendline, which support our medium-term long positions, the one issued few weeks ago at 1730. With that being said, it would be wise to move our stop loss for this week to 1765 USD/Oz to protect some of the profit, while further stabilization above 1775 may clear the way for another test of 1800 USD/Oz in the coming days.
Reference: FBS (23.08.2021) Gold holding well above 1775. FBS analytic news.
-
10-09-2021, 01:28 PM #29Senior Investor

- Join Date
- Apr 2018
- Posts
- 509
- Feedback Score
- 0
- Thanks
- 0
- Thanked 0 Times in 0 Posts

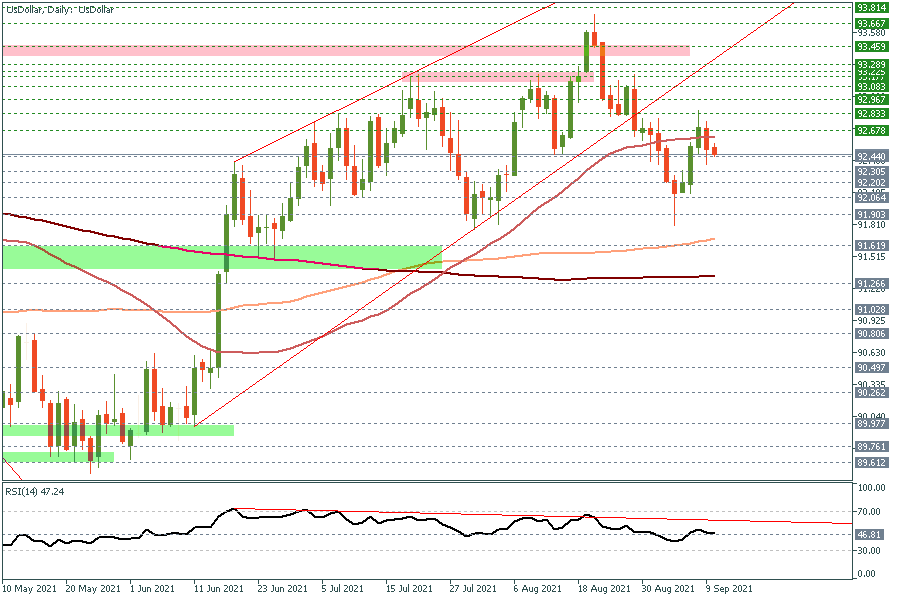
The US Dollar Index failed to sustain its recent gains above its 50 DAY MA, the index declined back yesterday with higher trading volume, while all eyes are on the PPI data today after mixed economic releases over the past few days and last week's jobs report. In the meantime, the technical indicators are still suggesting further declines ahead, with a possibility to retest last week's lows round 91.80, while any short position should be attached with a stop loss not to exceed this week's high.
Reference: FBS (10.09.2021) USD downside retracement resumes. FBS analytic news.
-
13-09-2021, 11:42 PM #30Senior Investor

- Join Date
- Apr 2018
- Posts
- 509
- Feedback Score
- 0
- Thanks
- 0
- Thanked 0 Times in 0 Posts

Usually, the gold price is driven by political and economic uncertainty, like economic crises, election pressure, pandemic effects. But in the face of a year-and-a-half-lasting monetary stimulus program, the price of the haven asset acts differently. What drives gold price and how to trade it – in this article.
Latest news:- Gold breaks beneath $1800 with $1700 as a reachable target.
- US 10-year Treasury yields rise, emphasizing the demand for the US dollar.
- Fed plans to start bond tapering this year.
- US inflation rate has already hit 5.4% in June and July 2021.
Retrospective gold movement analysis
Fundamental analysis of gold should start with an explanation of gold nature. In the past, there was the Gold Standard. It was a system under which nearly all countries fixed the value of their currencies in terms of a specified amount of gold or linked their currency to that of a country that did so. Also, the supply of gold hasn’t been increasing greatly with time. Thus, when the amount of money was increasing (inflation rises), to buy the same amount of gold we needed an increased amount of currency. Since the economic crises usually come with high inflation, gold has become the haven asset for every country.
But nothing lasts forever, and in August 1971, US President Nixon severed direct convertibility of US dollars into gold. From this very moment, gold has become a more independent asset, but the rules of the game didn’t change much. Demand for gold is still high due to several factors: gold is resistant to corrosion, easy to process, hard to imitate, and looks beautiful (the last factor is subjective).
From this point we have several considerations about gold price movements, let’s go through them:
- US treasury yield rises USD demand rises USD rises.
- When USD is rising, gold (XAU) is plunging (this has come from times of the Gold Standard and remained even after it).
- Gold supply isn’t increasing as fast as demand, thus, in the long-term gold will continue to rise.
What is affecting the price now?
Let’s go through several economic events and check whether they are affecting XAU price or not:
- March 31, 2021: US ADP NFP data is worse than expected (517K vs. 552K; positive for gold, negative for currency). Gold has been skyrocketing for the next 6 hours and has gained 2%.
- June 16, 2021: Federal funds rate remained at the same level (0.25%), which is positive for the currency. Also, there were intentions for rate hikes in the future. Gold has plunged 3% in 3 hours.
- August 6, 2021: positive US NFP data (943K actual vs. 870K expected). Gold has “flash crashed” by 6.2% in less than half a day.
- August 12, 2021: US PPI is higher than expected, which is positive for currency and negative for gold. XAU has fallen by 0.5% and surged 0.75% later that day.
- September 1, 2021: OPEC+ reconsider oil output increase by 400 000 barrels per day. Negative ADP NFP data (330K actual vs. 695K expected). Gold price has remained the same.
- September 3, 2021: US NFP three times worse than expected (235K vs. 720K). XAU has risen 1.15% in the next 3 hours, but in the next 3 days, gold had fallen more than 2%.
To sum up, this data, even if the events and the results are the same (March 31 and September 1), gold can act in a completely different manner. Besides that, we can expect gold to rise when any data is bad for USD and vice versa. This can be proven by looking at XAU/USD and US dollar index charts, or by looking at correlation charts.
What to expect from gold?
So far (September 13, 2021) the economic recovery is not as fast as everyone wants and while tapering has been postponed, again and again, the demand for the US dollar is present and gold is not in a good shape. You might think: “Wait, if the economy is in a bad shape, then it’s good for gold, isn’t it?” Yes, usually in times of uncertainty gold is showing better results than other assets, like stocks and currencies. But this doesn’t mean that gold doesn’t fall at all.
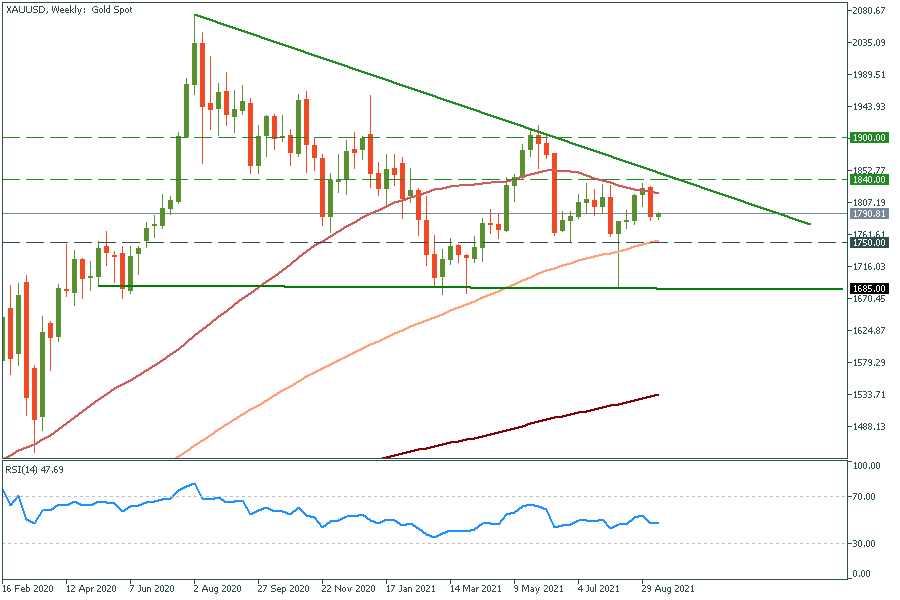
From the side of technical analysis, gold is looking bearish too.
XAU/USD weekly chart
Support: 1750.0; 1685.0
Resistance: 1840.0; 1900.0
Gold is a perfect instrument to keep your money safe because it tends to maintain its purchasing power and save you from the volatility of other assets, but as global markets tend to rise on a bigger time scale, gold won’t earn you a lot.
Reference: FBS (13.09.2021) Gold is acting randomly? FBS Analytic news
-
Sponsored Links
Thread Information
Users Browsing this Thread
There are currently 2 users browsing this thread. (0 members and 2 guests)
Tags for this Thread
24 Hour Gold
Advertising
- Over 20.000 UNIQUE Daily!
- Get Maximum Exposure For Your Site!
- Get QUALITY Converting Traffic!
- Advertise Here Today!
Out Of Billions Of Website's Online.
Members Are Online From.
- Get Maximum Exposure For Your Site!
- Get QUALITY Converting Traffic!
- Advertise Here Today!
Out Of Billions Of Website's Online.
Members Are Online From.


 LinkBack URL
 About LinkBacks


 Reply With Quote


